- Apps and Add-ons
- :
- All Apps and Add-ons
- :
- Is it possible to customize Wazuh -> Overview -> S...
- Subscribe to RSS Feed
- Mark Topic as New
- Mark Topic as Read
- Float this Topic for Current User
- Bookmark Topic
- Subscribe to Topic
- Mute Topic
- Printer Friendly Page
- Mark as New
- Bookmark Message
- Subscribe to Message
- Mute Message
- Subscribe to RSS Feed
- Permalink
- Report Inappropriate Content
Hi!
Is it possible to customize Wazuh -> Overview -> Security Events Dashboard? and remove several charts?
Do I need to modify js code?
- Mark as New
- Bookmark Message
- Subscribe to Message
- Mute Message
- Subscribe to RSS Feed
- Permalink
- Report Inappropriate Content
Hi,
Yes, you can customize or remove charts if you need to. To do that you will have to modify the Wazuh App js/html code but it's quite simple I will explain you how to do it:
-That specific dashboard you mentioned, Wazuh -> Overview -> Security Events Dashboard, can be found here: {{SPLUNK_DIR}}/etc/apps/SplunkAppForWazuh/appserver/static/js/controllers/overview/general/ in my case is /opt/splunk/etc/apps/SplunkAppForWazuh/appserver/static/js/controllers/overview/general/
In that folder you will find 2 files:
overviewGeneralCtrl.js -> Here you will find all chart queries used to request data to splunk
overview-general.html -> Here you will find the HTML code that creates the view.
-If you want to remove a chart you can do that by simply removing it from the overview-general.html.
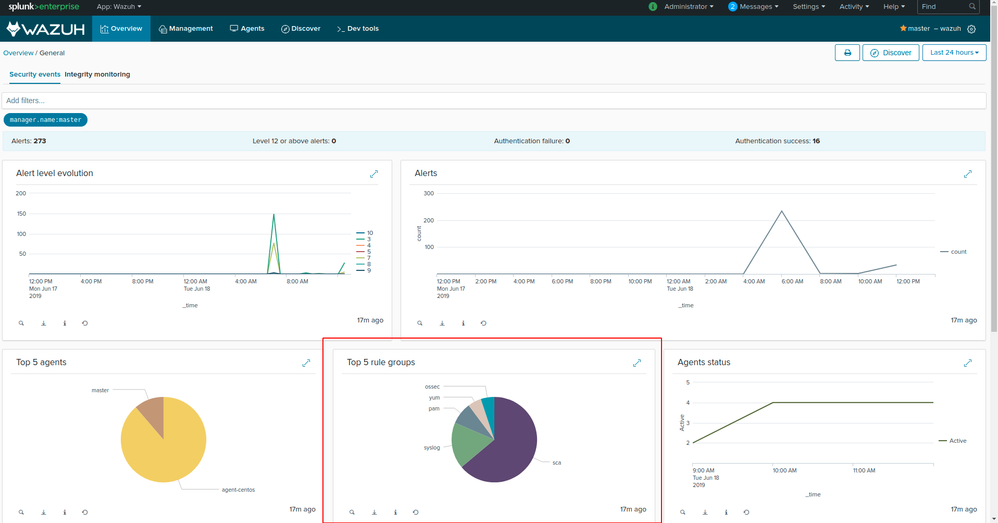
For example if we want to remove "Top 5 rule groups" chart,
We can easily find that chart doing a search by its name Top 5 rule groups and we will find this following <md-card >...</md-card> in the .html file:
```
  <md-card flex="33" class="wz-md-card" ng-class="{'fullscreen': expandArray[3]}">
    <md-card-content class="wazuh-column">
      <span class="wz-headline-title">Top 5 rule groups
        <span class="wz-text-link" style="float:right;" ng-click="expand(3,'top5ruleGroups')">
          <wz-svg icon="expand"></wz-svg>
        </span>
      </span>
      <md-divider class="wz-margin-top-10"></md-divider>
      <div id='top5ruleGroups'></div>
    </md-card-content>
  </md-card>
``
So all we have to do is to remove that
Once you removed that block of code you should restart splunk (/opt/splunk/bin/splunk restart)
If after following these steps, the chart is still being shown in the dashboard, try clearing your browser cookies and cache.
-What if we want to customize a specific chart and do a different search in it?
In your file.html:
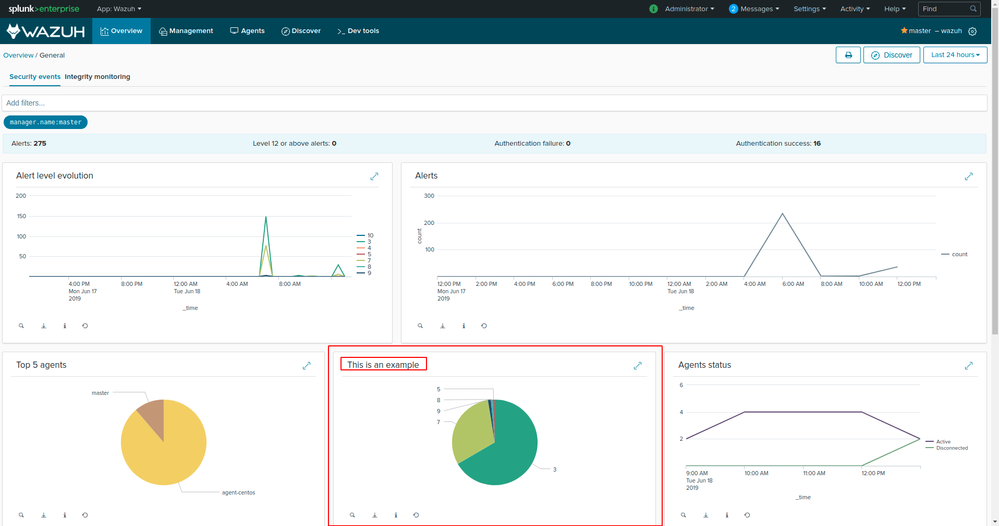
1-Change the chart title, in my case I replaced "Top 5 rule groups" with "This is an example".
2-We will need the id of the chart in this example id="top5ruleGroups" in order to modify the query of that search.
Now in your file .js (in this example, overviewGeneralCtrl.js), you will find the following block code containing the previous id = 'top5ruleGroups':
```
    new PieChart(
      'top5ruleGroups',
      `${this.filters} sourcetype=wazuh | top rule.groups{} limit=5`,
      'top5ruleGroups',
      this.scope
    ),
As you can see,  we can know this query belongs to that chart because it has the same id `top5ruleGroups`.

The search query is  `${this.filters} sourcetype=wazuh | top rule.groups{} limit=5`, so all we have to do is to replace that query after the single vertical bar (|), for example, I will change it for a dummy search by`rule.level`
    new PieChart(
      'top5ruleGroups',
      `${this.filters} sourcetype=wazuh | top rule.level limit=5`,
      'top5ruleGroups',
      this.scope
    ),
``
Also note that
As you can see our old "Top 5 rule groups" chart has been replaced with our "This is an example" chart and the chart is showing the top 5 rule levels.
I hope this helps, it may be a little bit messy but if you need anything else I will be happy to help.
I also encourage you to ask or make any suggestion in our github repository (https://github.com/wazuh/wazuh-splunk) if you have any question we will be glad to help.
Regards,
- Mark as New
- Bookmark Message
- Subscribe to Message
- Mute Message
- Subscribe to RSS Feed
- Permalink
- Report Inappropriate Content
Thanks a lot!


