- Apps and Add-ons
- :
- All Apps and Add-ons
- :
- Re: How to show only the selected time in axis lab...
- Subscribe to RSS Feed
- Mark Topic as New
- Mark Topic as Read
- Float this Topic for Current User
- Bookmark Topic
- Subscribe to Topic
- Mute Topic
- Printer Friendly Page
- Mark as New
- Bookmark Message
- Subscribe to Message
- Mute Message
- Subscribe to RSS Feed
- Permalink
- Report Inappropriate Content
How to show only the selected time in axis label in timeline custom visualization?
HI,
I have searching data from only first 6 days of each month i.e for example: from 1st April to 4th April 2020
My first time value is 04/01/2020 09:20 and the latest is 04/07/2020 07:05, but in the timeline chart visualization its displaying axis label as 04/01/2020 04/07/2020 04/14/2020 ........ 05/02/2020
Is it possible to force the timeline to display the full range of only my search, or manually set the time range?
I want the timeline to always displays the values which only in time field .
Any advice and assistance is appreciated. Thanks,
- Mark as New
- Bookmark Message
- Subscribe to Message
- Mute Message
- Subscribe to RSS Feed
- Permalink
- Report Inappropriate Content
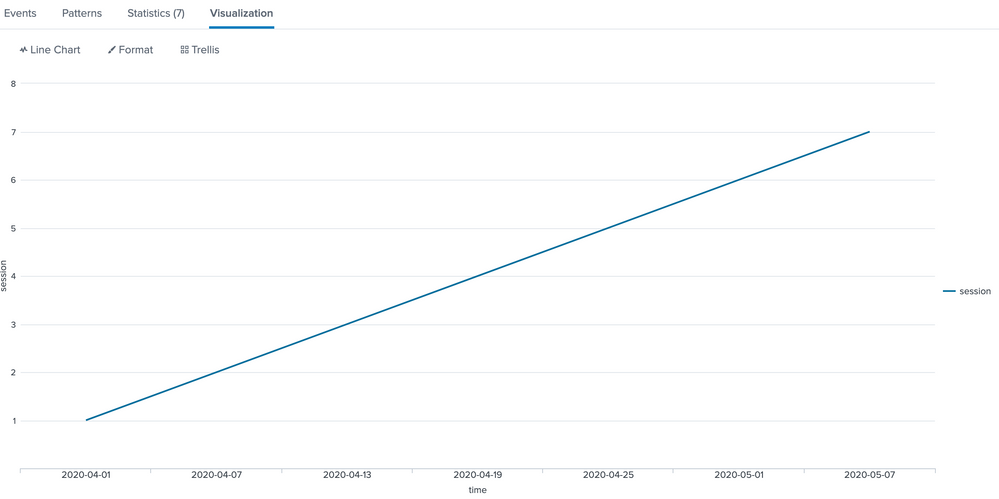
sample:
| makeresults count=2
| streamstats count
| eval _time=if(count=1,relative_time(_time,"@mon"),relative_time(_time,"+1mon@mon+7d"))
| makecontinuous span=1d _time
| streamstats count as test
| streamstats count(eval(test % 6 = 1)) as session
| stats min(eval(round(_time))) as time by session
| eval time=strftime(time,"%F")
| table time session
If x-axis is text, it displays good.
- Mark as New
- Bookmark Message
- Subscribe to Message
- Mute Message
- Subscribe to RSS Feed
- Permalink
- Report Inappropriate Content
- Mark as New
- Bookmark Message
- Subscribe to Message
- Mute Message
- Subscribe to RSS Feed
- Permalink
- Report Inappropriate Content
@to4kawa ohh , not line chart . I am saying about timeline custom visualization.
- Mark as New
- Bookmark Message
- Subscribe to Message
- Mute Message
- Subscribe to RSS Feed
- Permalink
- Report Inappropriate Content
I see, I'm sorry misunderstand.
- Mark as New
- Bookmark Message
- Subscribe to Message
- Mute Message
- Subscribe to RSS Feed
- Permalink
- Report Inappropriate Content
@to4kawa Thank you for your reply.
I tried to execute the above sample query , but still in Timeline visualization , axis labels showing
04/05/2020 04/12/2020 04/19/2020 04/26/2020 05/03/2020
It should display as below for above sample query
04/01/2020 04/07/2020 04/13/2020 04/19/2020 04/25/2020 05/01/2020 05/07/2020
Please suggest.

