Are you a member of the Splunk Community?
- Find Answers
- :
- Apps & Add-ons
- :
- All Apps and Add-ons
- :
- Re: How to replicate dashboards in the Tenable Net...
- Subscribe to RSS Feed
- Mark Topic as New
- Mark Topic as Read
- Float this Topic for Current User
- Bookmark Topic
- Subscribe to Topic
- Mute Topic
- Printer Friendly Page
- Mark as New
- Bookmark Message
- Subscribe to Message
- Mute Message
- Subscribe to RSS Feed
- Permalink
- Report Inappropriate Content
Greetings,
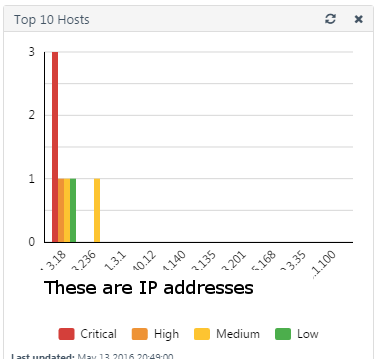
I am trying to replicate the dashboards found in the Tenable PVS environment. First, this is the dashboard I am after:
Note the IPs are top 10 and the colors are the severity.
From the data, I have this chart which I think gets me close, but for it to work, I would have to sort by Critical, then by High, then Medium, etc and then take the top 10 IP addresses.
index=pvs | chart count(eval(PVS_risk="CRITICAL")) AS CRITICAL , count(eval(PVS_risk="HIGH")) AS HIGH, count(eval(PVS_risk="MEDIUM")) AS MEDIUM, count(eval(PVS_risk="LOW")) AS LOW, count(eval(PVS_risk="INFO")) AS INFO, count(eval(PVS_risk="NONE")) AS NONE by src
Can anyone offer any pointers or similar dashboards I may be able to leverage?
BTW, I have the PVS app configured and all the dashes displaying, but I wanted to get ALL of the PVS dashboards into Splunk.
Thanks!
- Mark as New
- Bookmark Message
- Subscribe to Message
- Mute Message
- Subscribe to RSS Feed
- Permalink
- Report Inappropriate Content
If you want to sort by severity and not total events, try this:
index=pvs | chart count(eval(PVS_risk="CRITICAL")) AS CRITICAL , count(eval(PVS_risk="HIGH")) AS HIGH, count(eval(PVS_risk="MEDIUM")) AS MEDIUM, count(eval(PVS_risk="LOW")) AS LOW, count(eval(PVS_risk="INFO")) AS INFO, count(eval(PVS_risk="NONE")) AS NONE by src | sort 10 - CRITICAL,HIGH,MEDIUM,LOW,INFO
- Mark as New
- Bookmark Message
- Subscribe to Message
- Mute Message
- Subscribe to RSS Feed
- Permalink
- Report Inappropriate Content
I think you got it mokuso. I did some testing with removing variables from the sort and am now sure I understand how it is working. Though the Infos and Nones dwarft the rest of my stats, I could choose to remove those from earlier in the search.
Anyway, thanks so much!
Dave
- Mark as New
- Bookmark Message
- Subscribe to Message
- Mute Message
- Subscribe to RSS Feed
- Permalink
- Report Inappropriate Content
Hi Dave,
The pvs app is due for an update. I'm planning to add several new dashboards and a dedicated index by default. Is there anything else you'd like to see for the next release?
- Mark as New
- Bookmark Message
- Subscribe to Message
- Mute Message
- Subscribe to RSS Feed
- Permalink
- Report Inappropriate Content
Hi @mokuso
I have replicated all the dashboards in splunk except for the ones that extract the OS and Application. I just couldn't get the regex right. But those two are nice to haves. Anyway, I passed on your question for the next release to the lead on PVS over here and he seems happy with what we have but if you would like to have a more open conversation or like us to beta test, drop me a line at david (dot) geller (at) sfgov (dot) org. OH BTW, on the "replicated" dashboards, I added host, sourcetype (internal or external) and a time picker. So those are improvements on the PVS canned dashes as well.
Thanks,
Dave
- Mark as New
- Bookmark Message
- Subscribe to Message
- Mute Message
- Subscribe to RSS Feed
- Permalink
- Report Inappropriate Content
Try this
index=pvs | chart count as requests count(eval(PVS_risk="CRITICAL")) AS CRITICAL , count(eval(PVS_risk="HIGH")) AS HIGH, count(eval(PVS_risk="MEDIUM")) AS MEDIUM, count(eval(PVS_risk="LOW")) AS LOW, count(eval(PVS_risk="INFO")) AS INFO, count(eval(PVS_risk="NONE")) AS NONE by src | sort 10 - requests

