- Apps and Add-ons
- :
- All Apps and Add-ons
- :
- Re: How to caculate percentage of memory used valu...
- Subscribe to RSS Feed
- Mark Topic as New
- Mark Topic as Read
- Float this Topic for Current User
- Bookmark Topic
- Subscribe to Topic
- Mute Topic
- Printer Friendly Page
- Mark as New
- Bookmark Message
- Subscribe to Message
- Mute Message
- Subscribe to RSS Feed
- Permalink
- Report Inappropriate Content
How to caculate percentage of memory used value in each message and create time chart to show percentage value?
Hi Teams,
I am newbie to splunk, I have log message like this:
| 10/04/2022 10:12:31.000 | START RequestId: 46618528-6242-4eee-97b2-270e875bac1e Version: 165 END RequestId: 46618528-6242-4eee-97b2-270e875bac1e REPORT RequestId: 46618528-6242-4eee-97b2-270e875bac1e Duration: 68.98 ms Billed Duration: 69 ms Memory Size: 256 MB Max Memory Used: 170 MB START RequestId: 9a8f3f1e-aa03-40d9-a064-bb10a47a92eb Version: 163 END RequestId: 9a8f3f1e-aa03-40d9-a064-bb10a47a92eb REPORT RequestId: 9a8f3f1e-aa03-40d9-a064-bb10a47a92eb Duration: 3.76 ms Billed Duration: 4 ms Memory Size: 256 MB Max Memory Used: 184 MB |
I want to get MaxMemory Used value as percentage (Max Memory Used/Memory Size) in each message and create time chart to show this value. Can anyone help me in this!
- Mark as New
- Bookmark Message
- Subscribe to Message
- Mute Message
- Subscribe to RSS Feed
- Permalink
- Report Inappropriate Content
Thank you all
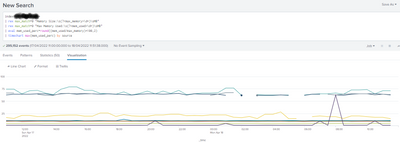
In my case it works with the below query:
index=my_index
| rex max_match=0 "Memory Size:\s(?<max_memory>\d+)\sMB"
| rex max_match=0 "Max Memory Used:\s(?<mem_used>\d+)\sMB"
| eval mem_used_perc=round((mem_used/max_memory)*100,2)
| timechart max(mem_used_perc) by source
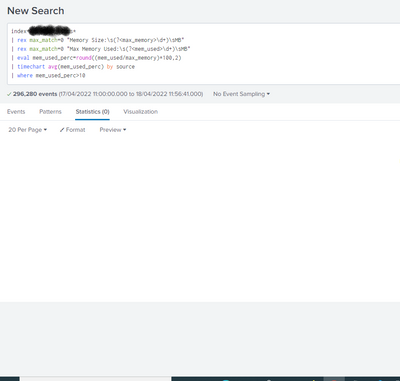
I want to add a condition to create an alarm when the mem_used_perc is over 80, but it does not work even I tried with value mem_used_perc >10. Below is my query:
index=my_index*
| rex max_match=0 "Memory Size:\s(?<max_memory>\d+)\sMB"
| rex max_match=0 "Max Memory Used:\s(?<mem_used>\d+)\sMB"
| eval mem_used_perc=round((mem_used/max_memory)*100,2)
| timechart max(mem_used_perc) by source
| where mem_used_perc>80
@tshah-splunk , @ITWhisperer , can you guys help me to correct it?
- Mark as New
- Bookmark Message
- Subscribe to Message
- Mute Message
- Subscribe to RSS Feed
- Permalink
- Report Inappropriate Content
Remove the timechart command
Given that you are looking for max values, you could just look for events which meet this criteria.
- Mark as New
- Bookmark Message
- Subscribe to Message
- Mute Message
- Subscribe to RSS Feed
- Permalink
- Report Inappropriate Content
Many thanks @ITWhisperer
In my case, it works with the below query:
index=my_index
| rex max_match=0 "Memory Size:\s(?<max_memory>\d+)\sMB"
| rex max_match=0 "Max Memory Used:\s(?<mem_used>\d+)\sMB"
| eval mem_used_perc=round((mem_used/max_memory)*100,2)
| where mem_used_perc>80
| timechart max(mem_used_perc) by source
- Mark as New
- Bookmark Message
- Subscribe to Message
- Mute Message
- Subscribe to RSS Feed
- Permalink
- Report Inappropriate Content
You could extract the values with rex.
| rex max_match=0 "Memory Size:\s(?<max_memory>\d+)\sMB"
| rex max_match=0 "Max Memory Used:\s(?<mem_used>\d+)\sMB"This will pick up both sets of values from your message in multi-value fields.
Do you want just one of them or do you want to work with both?
- Mark as New
- Bookmark Message
- Subscribe to Message
- Mute Message
- Subscribe to RSS Feed
- Permalink
- Report Inappropriate Content
Hey @hungln9,
You can use the eval function to perform arithmetical operations on the field values. Below is an expression that you can add to your search.
<<your_base_query>>
| eval mem_used_perc=round((mem_used/max_memory)*100,2)
| timechart span=<<time_span_interval>> mem_used_perc
PS: The above expression is written with the assumption that Max Memory Used is stored under field mem_used and Memory Size is stored under max_memory field.
If you find the answer helpful, an upvote/karma is appreciated


