- Apps and Add-ons
- :
- All Apps and Add-ons
- :
- How do I parse CISCO ASA 5510 firewall log in Splu...
- Subscribe to RSS Feed
- Mark Topic as New
- Mark Topic as Read
- Float this Topic for Current User
- Bookmark Topic
- Subscribe to Topic
- Mute Topic
- Printer Friendly Page
- Mark as New
- Bookmark Message
- Subscribe to Message
- Mute Message
- Subscribe to RSS Feed
- Permalink
- Report Inappropriate Content
How do I parse CISCO ASA 5510 firewall log in Splunk to get the expected search output?
I work for a cyber company to help commercial small businesses to provide services to investigate, analyze, and advise on cyber intrusion, detection, and hardening their IT networks. We response similar and act as a Incident Response team and we collect information and import data into splunk to index against the data collect such as USNJrnl, Internet metadata, Mail Logs, Event Logs, etc...
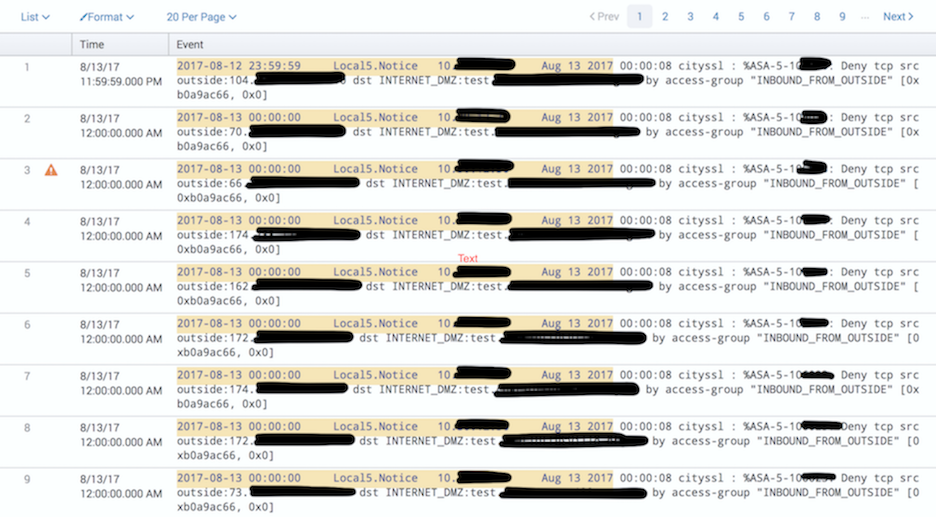
We received Cisco ASA 5510 Firewall Logs for a certain time period. I took all the files and index into splunk. When I search through the index, I feel the data is not parsed correctly or displaying in a readable format to give me a feeling of satisfaction. The image name Splunk 1 gives a screenshot of that data. I feel there should be columns for src ip, timestamp, dest ip, event, etc...
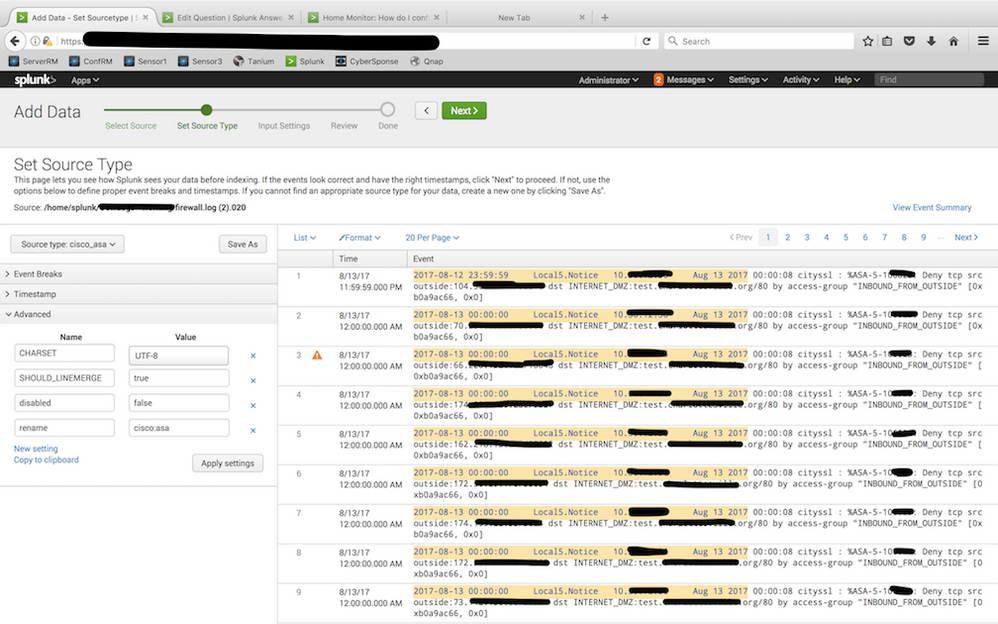
I have tried to use the splunk add-on cisco asa tool and cisco firesight as a source type in the second step of adding data into splunk process. The image name Splunk 2 gives a screenshot of how the data is displaying for the 2 mention add-ons.
The table format output for a Cisco ASA 5510 Firewall Log format is:
Columns read as such:
Time Event
Rows read as such:
1
2
3
The exact data below example:
Time: 1     8/13/17 11:59:59.000 PM

Event:    2017-08-12 23:59:59     Local5.Notice 10.30.x.x   Aug 13 2017 00:00:08 cityssl : %ASA-5-106023 Deny tcp src outside:104.x.x.x/52210 dst INTERNET_DMZ:test.xxxxxxx.org/80 by access-group "INBOUND_FROM_OUTSIDE" [0xb0a9ac66, 0x0]

Time: 2     8/13/17 12:00:00.000 AM

Event:   2017-08-13 00:00:00    Local5.Notice   10.30.x.x   Aug 13 2017 00:00:08 cityssl : %ASA-5-106023: Deny tcp src outside:70.x.x.x/50006 dst INTERNET_DMZ:test.xxxxxx.org/80 by access-group "INBOUND_FROM_OUTSIDE" [0xb0a9ac66, 0x0]

Time:  3            8/13/17 12:00:00.000 AM

Event:  2017-08-13 00:00:00 Local5.Notice   10.30.x.x   Aug 13 2017 00:00:08 cityssl : %ASA-5-106023: Deny tcp src outside:66.x.x.x/10048 dst INTERNET_DMZ:test.xxxxxx.org/80 by access-group "INBOUND_FROM_OUTSIDE" [0xb0a9ac66, 0x0]
May I please have some help how to use the advance feature within input data process of splunk to parse the data to be able to search correctly, to set as a template ASA index for future engagements, and/or any suggestions to make sure the data from an ASA Firewall Logs are outputted correctly to make searching easier.
Thanks in advance
Douglas
- Mark as New
- Bookmark Message
- Subscribe to Message
- Mute Message
- Subscribe to RSS Feed
- Permalink
- Report Inappropriate Content
Good day
For this problem that Splunk couldn't parse cisco syslog, i have to install add-on on splunk server and change source type? is it the last solution?
Thank you
- Mark as New
- Bookmark Message
- Subscribe to Message
- Mute Message
- Subscribe to RSS Feed
- Permalink
- Report Inappropriate Content
Hi, Douglas. I am having the same problem. Did you get to solve this? If so, can you share how?
Thank you in advance.
Juliana
- Mark as New
- Bookmark Message
- Subscribe to Message
- Mute Message
- Subscribe to RSS Feed
- Permalink
- Report Inappropriate Content
You need the Cisco ASa add-on installed and your data must be added using sourcetype "cisco:asa".
Furthermore there may be problems because your data is prefixed with some extra info from your syslog daemon such as the extra timestamp and the syslog facility (Local5.Notice), but if you're lucky the add-on handles this.
Give it a try using the suggested sourcetype and see if that helps.
Mikael
- Mark as New
- Bookmark Message
- Subscribe to Message
- Mute Message
- Subscribe to RSS Feed
- Permalink
- Report Inappropriate Content
What fields are you getting and what are you expecting for the field values you want from the sample data that you've provided? Cisco output usually can be depended on to be pretty much the same, but the expectation that you have may be different from that of others. Do you just care about these events? Because there are other events that are different from these events - buildups, teardown, denies, etc. They can all look different for parsing at search time. What are the fields that you want across the dataset you have?


