- Apps and Add-ons
- :
- All Apps and Add-ons
- :
- Fortinet FortiGate App for Splunk: Why am I receiv...
- Subscribe to RSS Feed
- Mark Topic as New
- Mark Topic as Read
- Float this Topic for Current User
- Bookmark Topic
- Subscribe to Topic
- Mute Topic
- Printer Friendly Page
- Mark as New
- Bookmark Message
- Subscribe to Message
- Mute Message
- Subscribe to RSS Feed
- Permalink
- Report Inappropriate Content
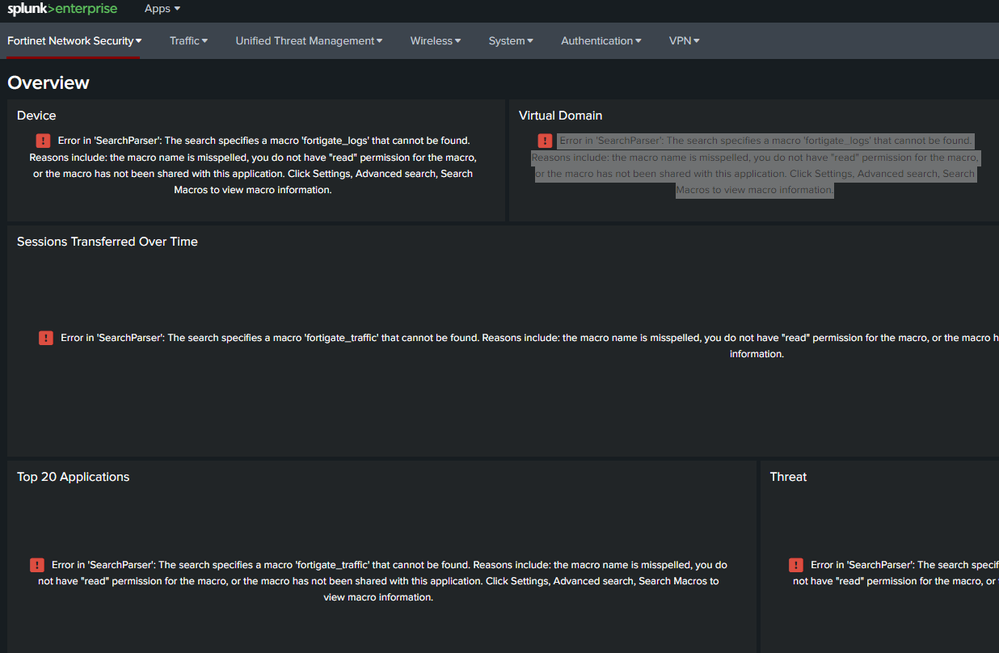
This is in every panel on the dashboard - "Error in 'SearchParser': The search specifies a macro 'fgt_logs' that cannot be found. Reasons include: the macro name is misspelled, you do not have "read" permission for the macro, or the macro has not been shared with this application. Click Settings, Advanced search, Search Macros to view macro information. "
In "Advanced search"-"search macro" I have only "_ftnt_dropdown(2)"
tstats summariesonly=true count FROM datamodel="ftnt_fos" WHERE nodename="$node$" groupby $field$ | rename $field$ as field | eval field_with_count = field . " (" . count . ")"
When I search data in Splunk-search I saw every log from fortigate.
Help me with this problem. What can I do?
- Mark as New
- Bookmark Message
- Subscribe to Message
- Mute Message
- Subscribe to RSS Feed
- Permalink
- Report Inappropriate Content
I suspect you didn't install the add-on for fortigate, where the macros are defined.
https://splunkbase.splunk.com/app/2846/
- Mark as New
- Bookmark Message
- Subscribe to Message
- Mute Message
- Subscribe to RSS Feed
- Permalink
- Report Inappropriate Content
Hello
Is it possible for someone to help?
I entered the log information into program, but the graphs do not show anything.
- Mark as New
- Bookmark Message
- Subscribe to Message
- Mute Message
- Subscribe to RSS Feed
- Permalink
- Report Inappropriate Content
Hi @Vox,
I’m a Community Moderator in the Splunk Community.
This question was posted 5 years ago, so it might not get the attention you need for your question to be answered. We recommend that you post a new question so that your issue can get the visibility it deserves. To increase your chances of getting help from the community, follow these guidelines in the Splunk Answers User Manual when creating your post.
Thank you!
- Mark as New
- Bookmark Message
- Subscribe to Message
- Mute Message
- Subscribe to RSS Feed
- Permalink
- Report Inappropriate Content
I suspect you didn't install the add-on for fortigate, where the macros are defined.
https://splunkbase.splunk.com/app/2846/
- Mark as New
- Bookmark Message
- Subscribe to Message
- Mute Message
- Subscribe to RSS Feed
- Permalink
- Report Inappropriate Content
Thank's jerryzhao. This is it. But now I have in dashboard overview - "Device 0", "Session 0" ect. And in dashboard traffic "No result found" on every panels.
When I search data in Splunk-search I saw every log from fortigate.
- Mark as New
- Bookmark Message
- Subscribe to Message
- Mute Message
- Subscribe to RSS Feed
- Permalink
- Report Inappropriate Content
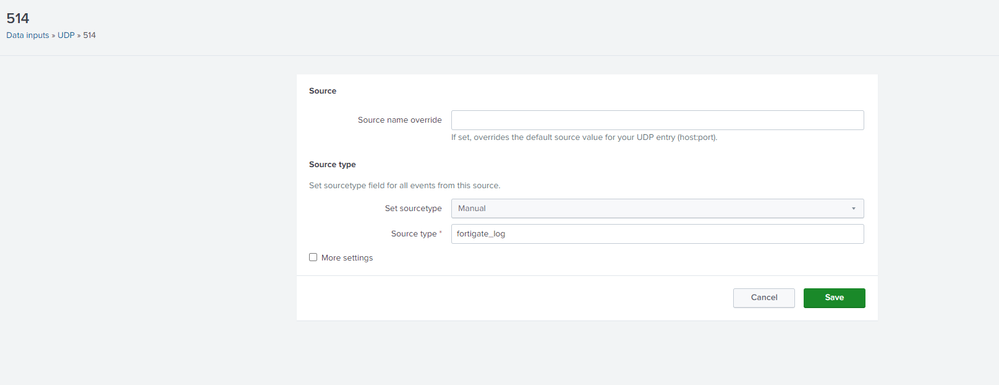
what are the sourcetypes shown in your search result? fgt_log? or fgt_event/fgt_traffic, etc? Please take a look at the troubleshooting section in the app's details.
- Mark as New
- Bookmark Message
- Subscribe to Message
- Mute Message
- Subscribe to RSS Feed
- Permalink
- Report Inappropriate Content
It works. Removing/uninstall app and add-on, reinstalling, copying the props.conf file from the default folder to the local folder, and editing this file (fgt_log change) helped.
Thanks again for help in need.


