- Splunk Answers
- :
- Using Splunk
- :
- Alerting
- :
- Windows High Memory Usage Per Process-Alert
- Subscribe to RSS Feed
- Mark Topic as New
- Mark Topic as Read
- Float this Topic for Current User
- Bookmark Topic
- Subscribe to Topic
- Mute Topic
- Printer Friendly Page
- Mark as New
- Bookmark Message
- Subscribe to Message
- Mute Message
- Subscribe to RSS Feed
- Permalink
- Report Inappropriate Content
Windows High Memory Usage Per Process-Alert
Hi,
Could someone please help me with the Alert for High Memory Usage Per Process
Whenever the memory used per process is higher that 90% then trigger an alert.
Below is the query which I tried but not working.
index="index" sourcetype="PerfmonMk:Process" process_name="sqlservr"
| eval Proc_Mem_mb = process_mem_used / (1024 * 1024)
| fields Proc_Mem_mb process_name host _time
| join host [ search index="index2" sourcetype="WinHostMon" Type=OperatingSystem | eval Tot_Mem_mb = TotalPhysicalMemoryKB/1024 | fields host Tot_Mem_mb ]
| eval high_mem_per_proc = ( (Proc_Mem_mb/Tot_Mem_mb) * 100 )
| eval AlertStatus=if(high_mem_per_proc > 90, "Alert", "Ignore")
|table _time host process_name Tot_Mem_mb Proc_Mem_mb high_mem_per_proc AlertStatus
| search AlertStatus="Alert"
- Mark as New
- Bookmark Message
- Subscribe to Message
- Mute Message
- Subscribe to RSS Feed
- Permalink
- Report Inappropriate Content
Please explain what "not working" means. What is not working? Does the query not find results or the alert not fire or something else? Have you confirmed at least one process is using 90% of memory?
May I suggest these lines to replace the last four?
| eval high_mem_per_proc = (Proc_Mem_mb * 100)/Tot_Mem_mb
| where high_mem_per_proc > 90
| table _time host process_name Tot_Mem_mb Proc_Mem_mb high_mem_per_proc AlertStatusIf this reply helps you, Karma would be appreciated.
- Mark as New
- Bookmark Message
- Subscribe to Message
- Mute Message
- Subscribe to RSS Feed
- Permalink
- Report Inappropriate Content
- Thank you for responding
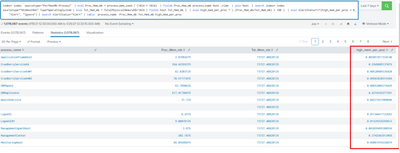
Below is the screenshot of my results and high_mem_per_proc is not giving exact results
- Mark as New
- Bookmark Message
- Subscribe to Message
- Mute Message
- Subscribe to RSS Feed
- Permalink
- Report Inappropriate Content
According to my calculator, the high_mem_per_proc field is exactly what it should be. What result are you expecting?
If this reply helps you, Karma would be appreciated.
- Mark as New
- Bookmark Message
- Subscribe to Message
- Mute Message
- Subscribe to RSS Feed
- Permalink
- Report Inappropriate Content
@richgallowaywe observed that process_mem_used data is not being sent to splunk.
Could you please provide Stanza to add in input.conf
- Mark as New
- Bookmark Message
- Subscribe to Message
- Mute Message
- Subscribe to RSS Feed
- Permalink
- Report Inappropriate Content
process_mem_used is a calculated field defined by the splunk_TA_nix and splunk_TA_windows apps. It's part of the ps and Perfmon:Process sourcetypes.
If this reply helps you, Karma would be appreciated.

